

On this page
How much pharma invests in R&D in Europe, according to EFPIA
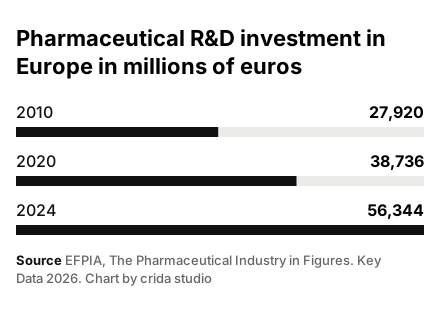
Pharmaceutical R&D spending in Europe reached €56,344 million in 2024. These are official figures from EFPIA member associations, covering the EU, Norway, Switzerland, the United Kingdom and a few other countries. In 2010 the figure was €27,920 million, and in 2020 it was €38,736 million. In fourteen years it has more than doubled.
EFPIA puts 2025 at around €60,000 million, but that is its own estimate, so it is left out of the chart. For a supplier the message is simple. European pharma customers spend more on research every year, and part of that budget ends up in labs, pilot plants, clinical trials and outsourced services.
The European Commission report on the 2,000 companies that invest most in R&D worldwide points the same way. In 2024 the health sector worldwide, which covers pharma, biotech and medical technology, spent 13.4% of its sales on R&D, more than any other sector. The 57 EU-based health companies in the ranking invested €46.3 billion, 13% more than the year before.
| Year | Millions of euros |
|---|---|
| 2010 | 27,920 |
| 2020 | 38,736 |
| 2024 | 56,344 |
Where research happens and where medicines are made
Research is concentrated in a handful of countries. In 2024 the United Kingdom spent €11,023 million and Germany €10,728 million, both official figures. Switzerland, Belgium and France follow, but with estimates or 2023 data. Production paints a different map. Ireland, Switzerland and Italy top the production table, all three with estimated figures.
That is why there is no country chart here. Many values are estimates or refer to another year, and bars would make them look comparable. The table gives the figures exactly as EFPIA publishes them, with the note for each case.
| Country | R&D | Production |
|---|---|---|
| Germany | 10,728 | 37,451 |
| United Kingdom | 11,023 | 36,745 (2023 data) |
| Switzerland | 9,553 (estimate) | 63,975 (estimate) |
| Belgium | 5,966 (estimate) | 27,661 |
| France | 5,900 (2023 data, estimate) | 33,012 (estimate) |
| Italy | 2,300 (estimate) | 56,100 (estimate) |
| Denmark | 2,122 (estimate) | 37,559 (estimate) |
| Ireland | 305 (2013 data, estimate) | 87,713 (estimate) |
| Spain | 1,647 | 20,380 (2023 data, estimate) |
How much does the pharmaceutical industry invest in R&D in Europe?
According to EFPIA, €56,344 million in 2024, based on official figures from its member associations. For 2025, EFPIA estimates around €60,000 million. The series covers the EU, Norway, Switzerland, the United Kingdom and other European countries, and has more than doubled since 2010, when it stood at €27,920 million.
Research and production may buy different things
A useful working hypothesis for marketing is that research-heavy countries mostly buy lab and pilot-scale equipment, while production-heavy countries buy GMP capacity. EFPIA does not measure equipment purchases. Treat it as a pointer for setting priorities and check it against your own sales.
Ireland has the highest production in the table, an estimated €87,713 million. Its R&D figure is a 2013 estimate and says little about research there today. If the hypothesis holds, Ireland would matter more to a CDMO or a seller of production systems than to someone selling benchtop bioreactors. Germany and the United Kingdom score high on both and could buy across the whole range.
Want us to cross these tables with your sales by country? Leave your details and we will tell you which markets we would look at first.
Let's lookWhat these figures change in your marketing plan
Reading the two tables together helps you decide where to put money and time. Before changing anything, cross them with your own sales and the contacts you already have in each country. These are the parts of the plan where it shows most.
David Monje, founder of crida studio, led marketing at TECNIC Bioprocess Solutions for four and a half years. There he acted as the bridge between engineering, product and sales to open markets such as Germany, Scandinavia and Asia. When we help companies prioritise markets, we use the same approach, crossing public data with what the sales team sees.
- Markets. Split the countries where you sell lab and pilot equipment from those where you sell production capacity.
- Content. Application notes and webinars for research labs, and scale-up stories, URS, FAT and SAT material for GMP plants.
- Website languages. German and English reach the two countries with the most R&D. Before adding another language, check whether that country is research-led or production-led.
- Campaigns. Google Ads and LinkedIn by country and by profile, with different messages for research and for production.
- Trade shows. A lab show and a pharma manufacturing show attract different audiences.
Which European country invests most in pharmaceutical R&D?
In the EFPIA 2024 table, the United Kingdom reports €11,023 million and Germany €10,728 million, both official figures. Switzerland reports €9,553 million, but that is an estimate. Belgium and France come next, also with estimates or 2023 data, so the exact order between them should be read with care.
What the figures say about Spain
Spain reported €1,647 million of pharmaceutical R&D in 2024, an official figure. Its production figure, €20,380 million, is from 2023 and is an estimate. With those caveats, production weighs far more than research in Spain, as it does in Italy, while research carries more weight in Germany and the United Kingdom.
For a Spanish or Catalan manufacturer, this may mean manufacturing weighs more than research in the home market. Lab sales may have more room to grow abroad. Check it against your own data before moving any budget.
Can this data be used to size the equipment market?
Not directly. It shows where research and production happen, which helps you rank countries. R&D spending includes salaries, clinical trials and services, and EFPIA does not measure equipment purchases. To size the market for a specific product you need to combine it with your own sales, your contacts and other public sources.
How to read these figures without getting them wrong
The country tables mix official figures, estimates and different years. France and Poland report 2023 R&D, Ireland 2013, and production for the United Kingdom and Spain is from 2023. Use the figures to sort countries into broad groups, not to calculate market shares.
Do not confuse these figures with the equipment market either. R&D includes salaries, clinical trials and services, and production is the value of what is made. They are demand signals. If you need a market size for your product, you need your own analysis built on your sales data and other public sources.
